
One of the first examples of MRI, ca 1974. Made by the research group of Richard Ernst in Zurich, acquired by Anil Kumar in July 1974.
source
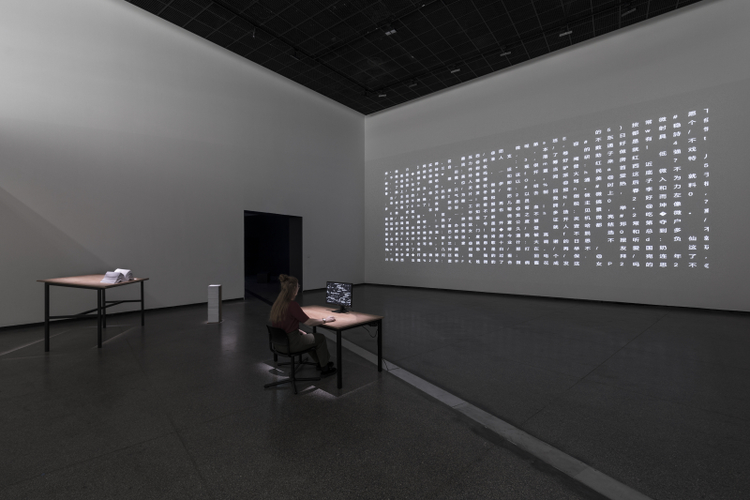
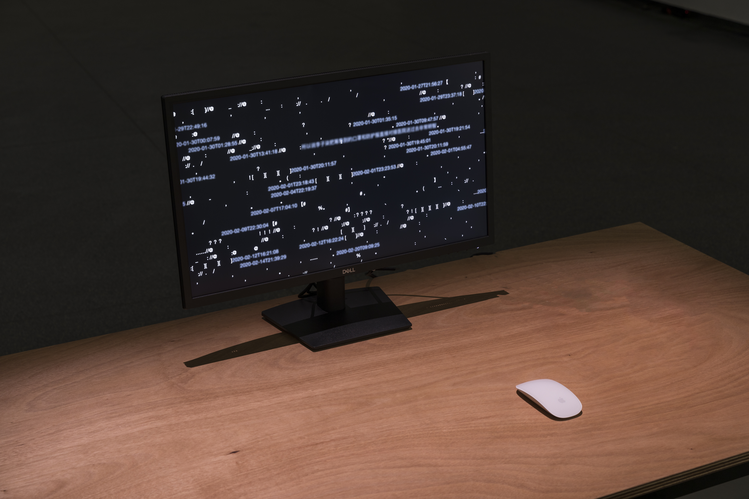
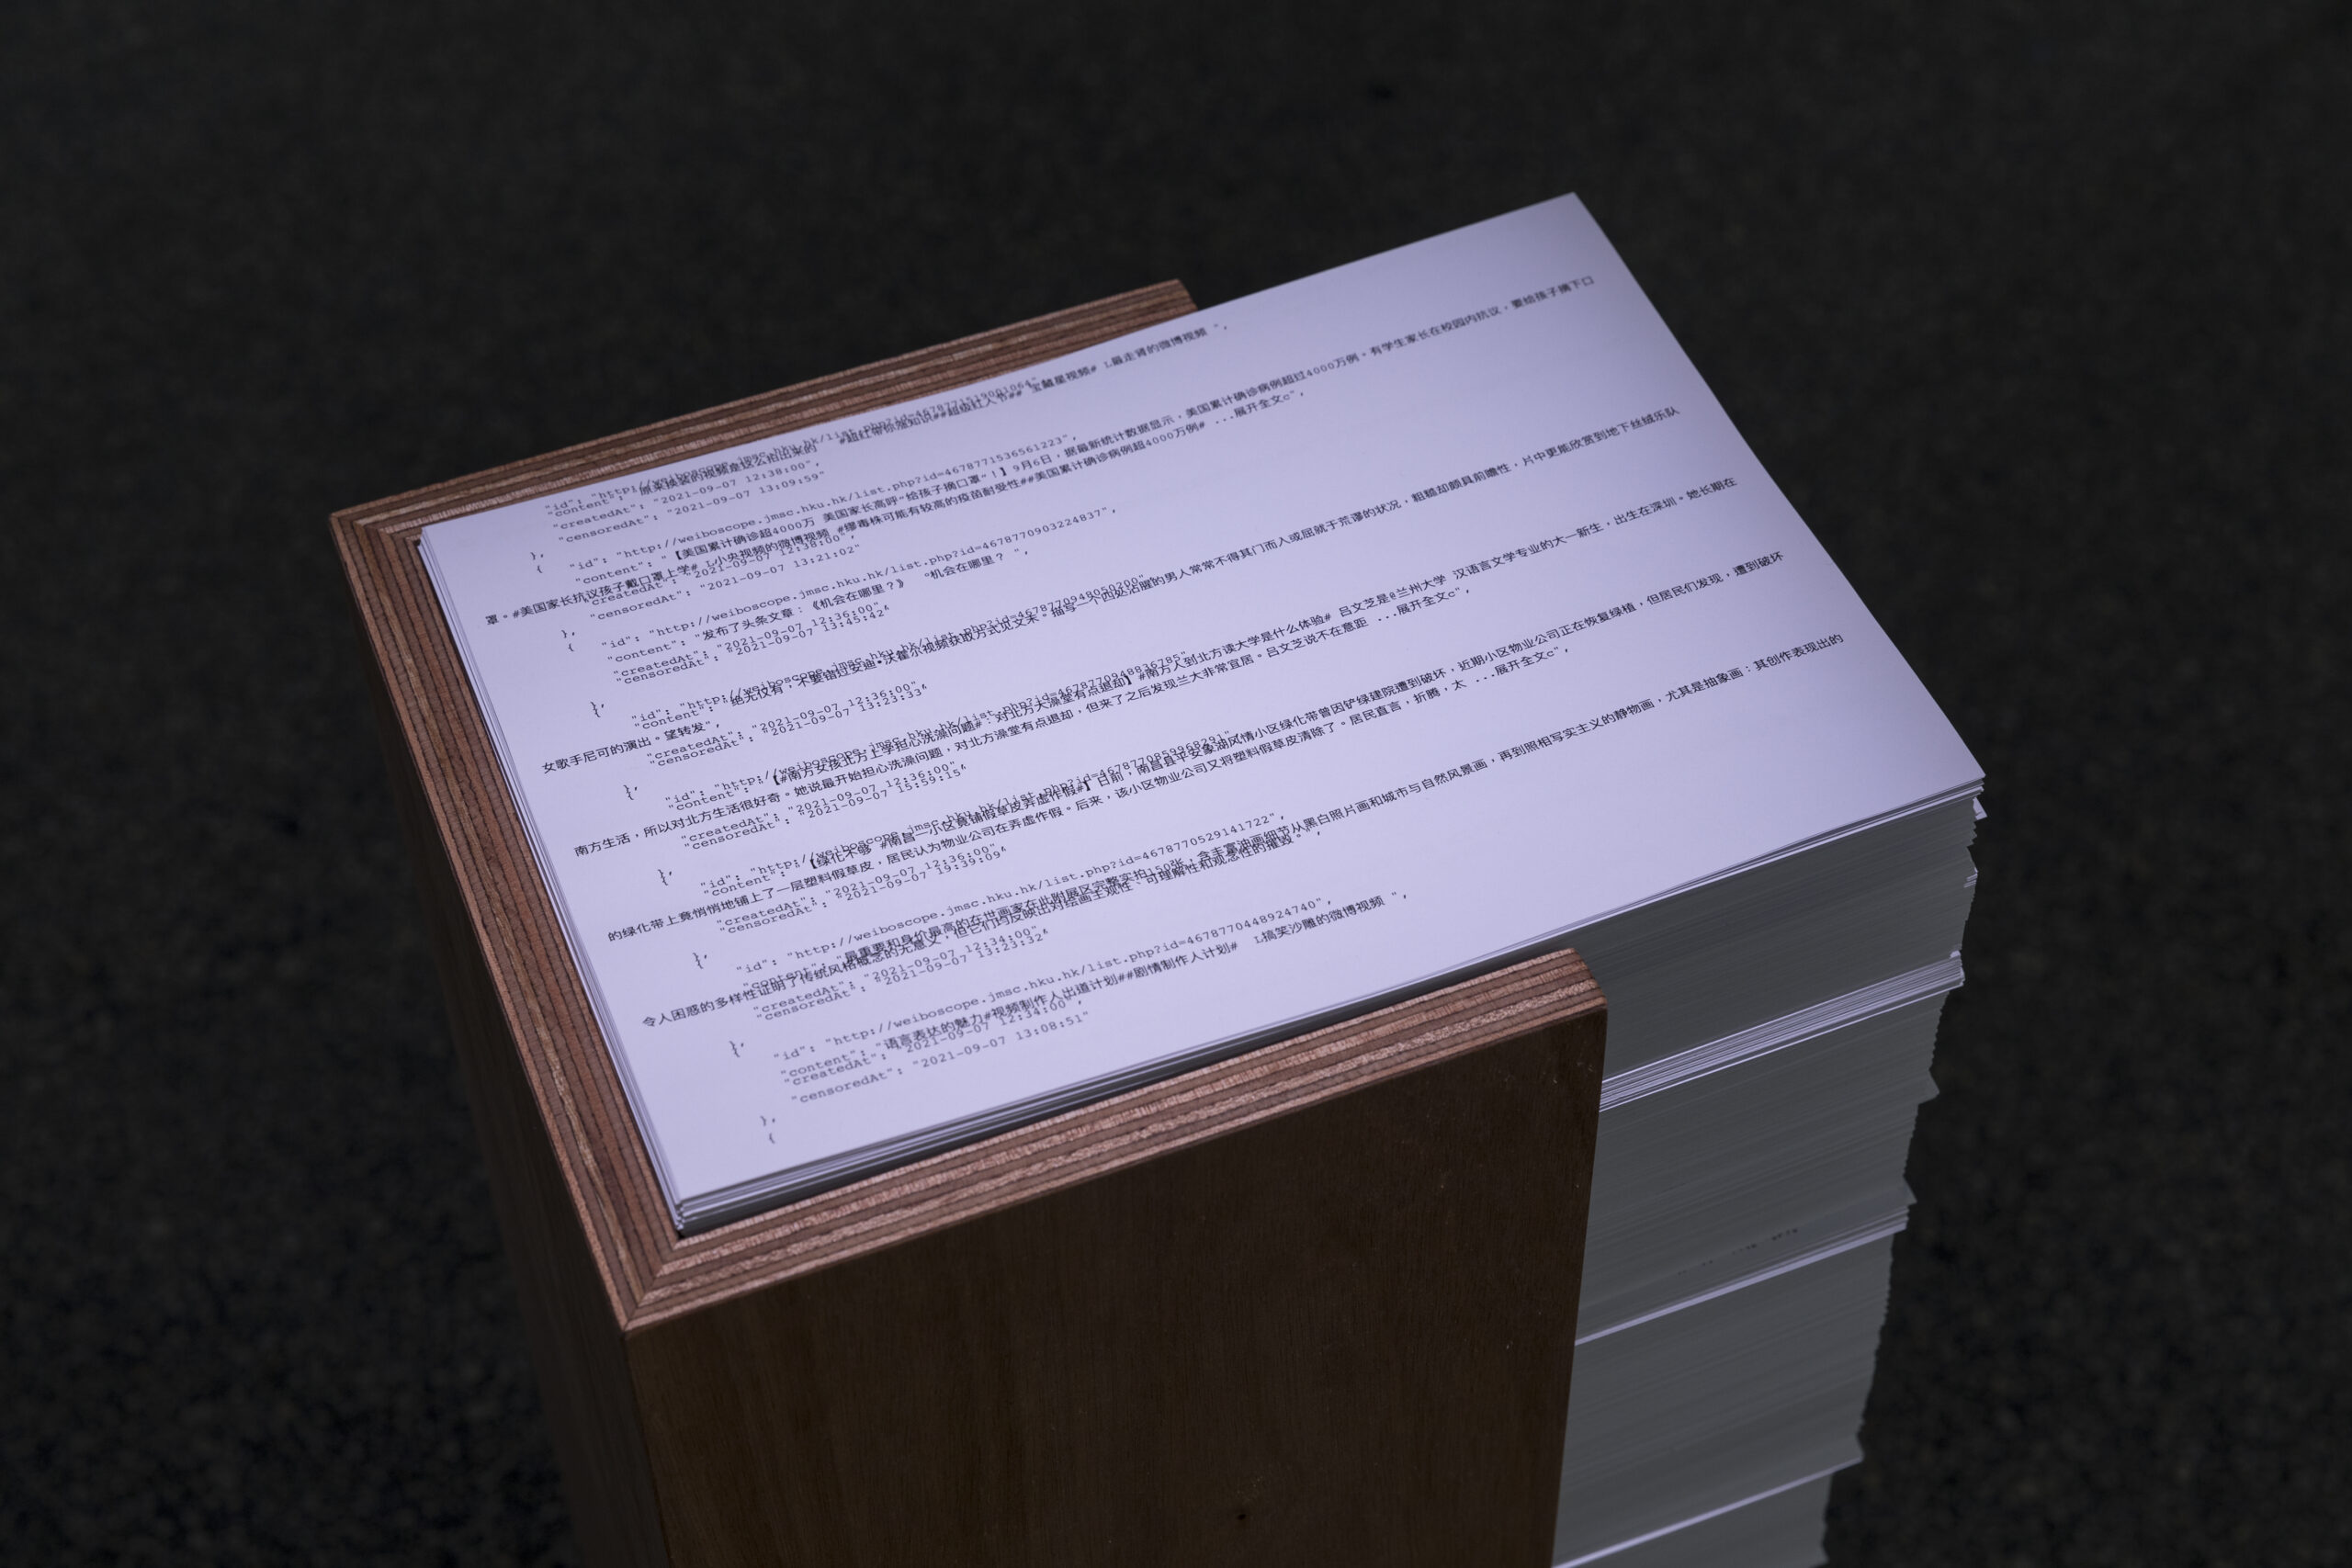
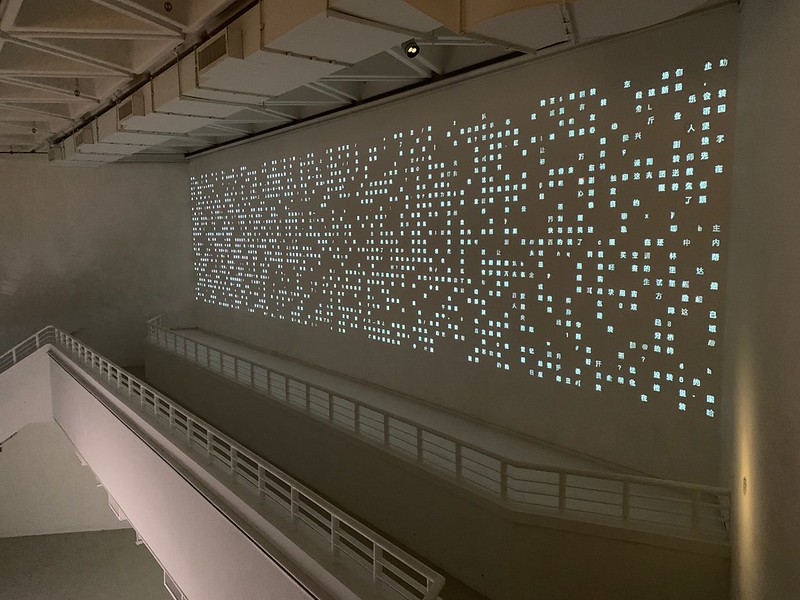
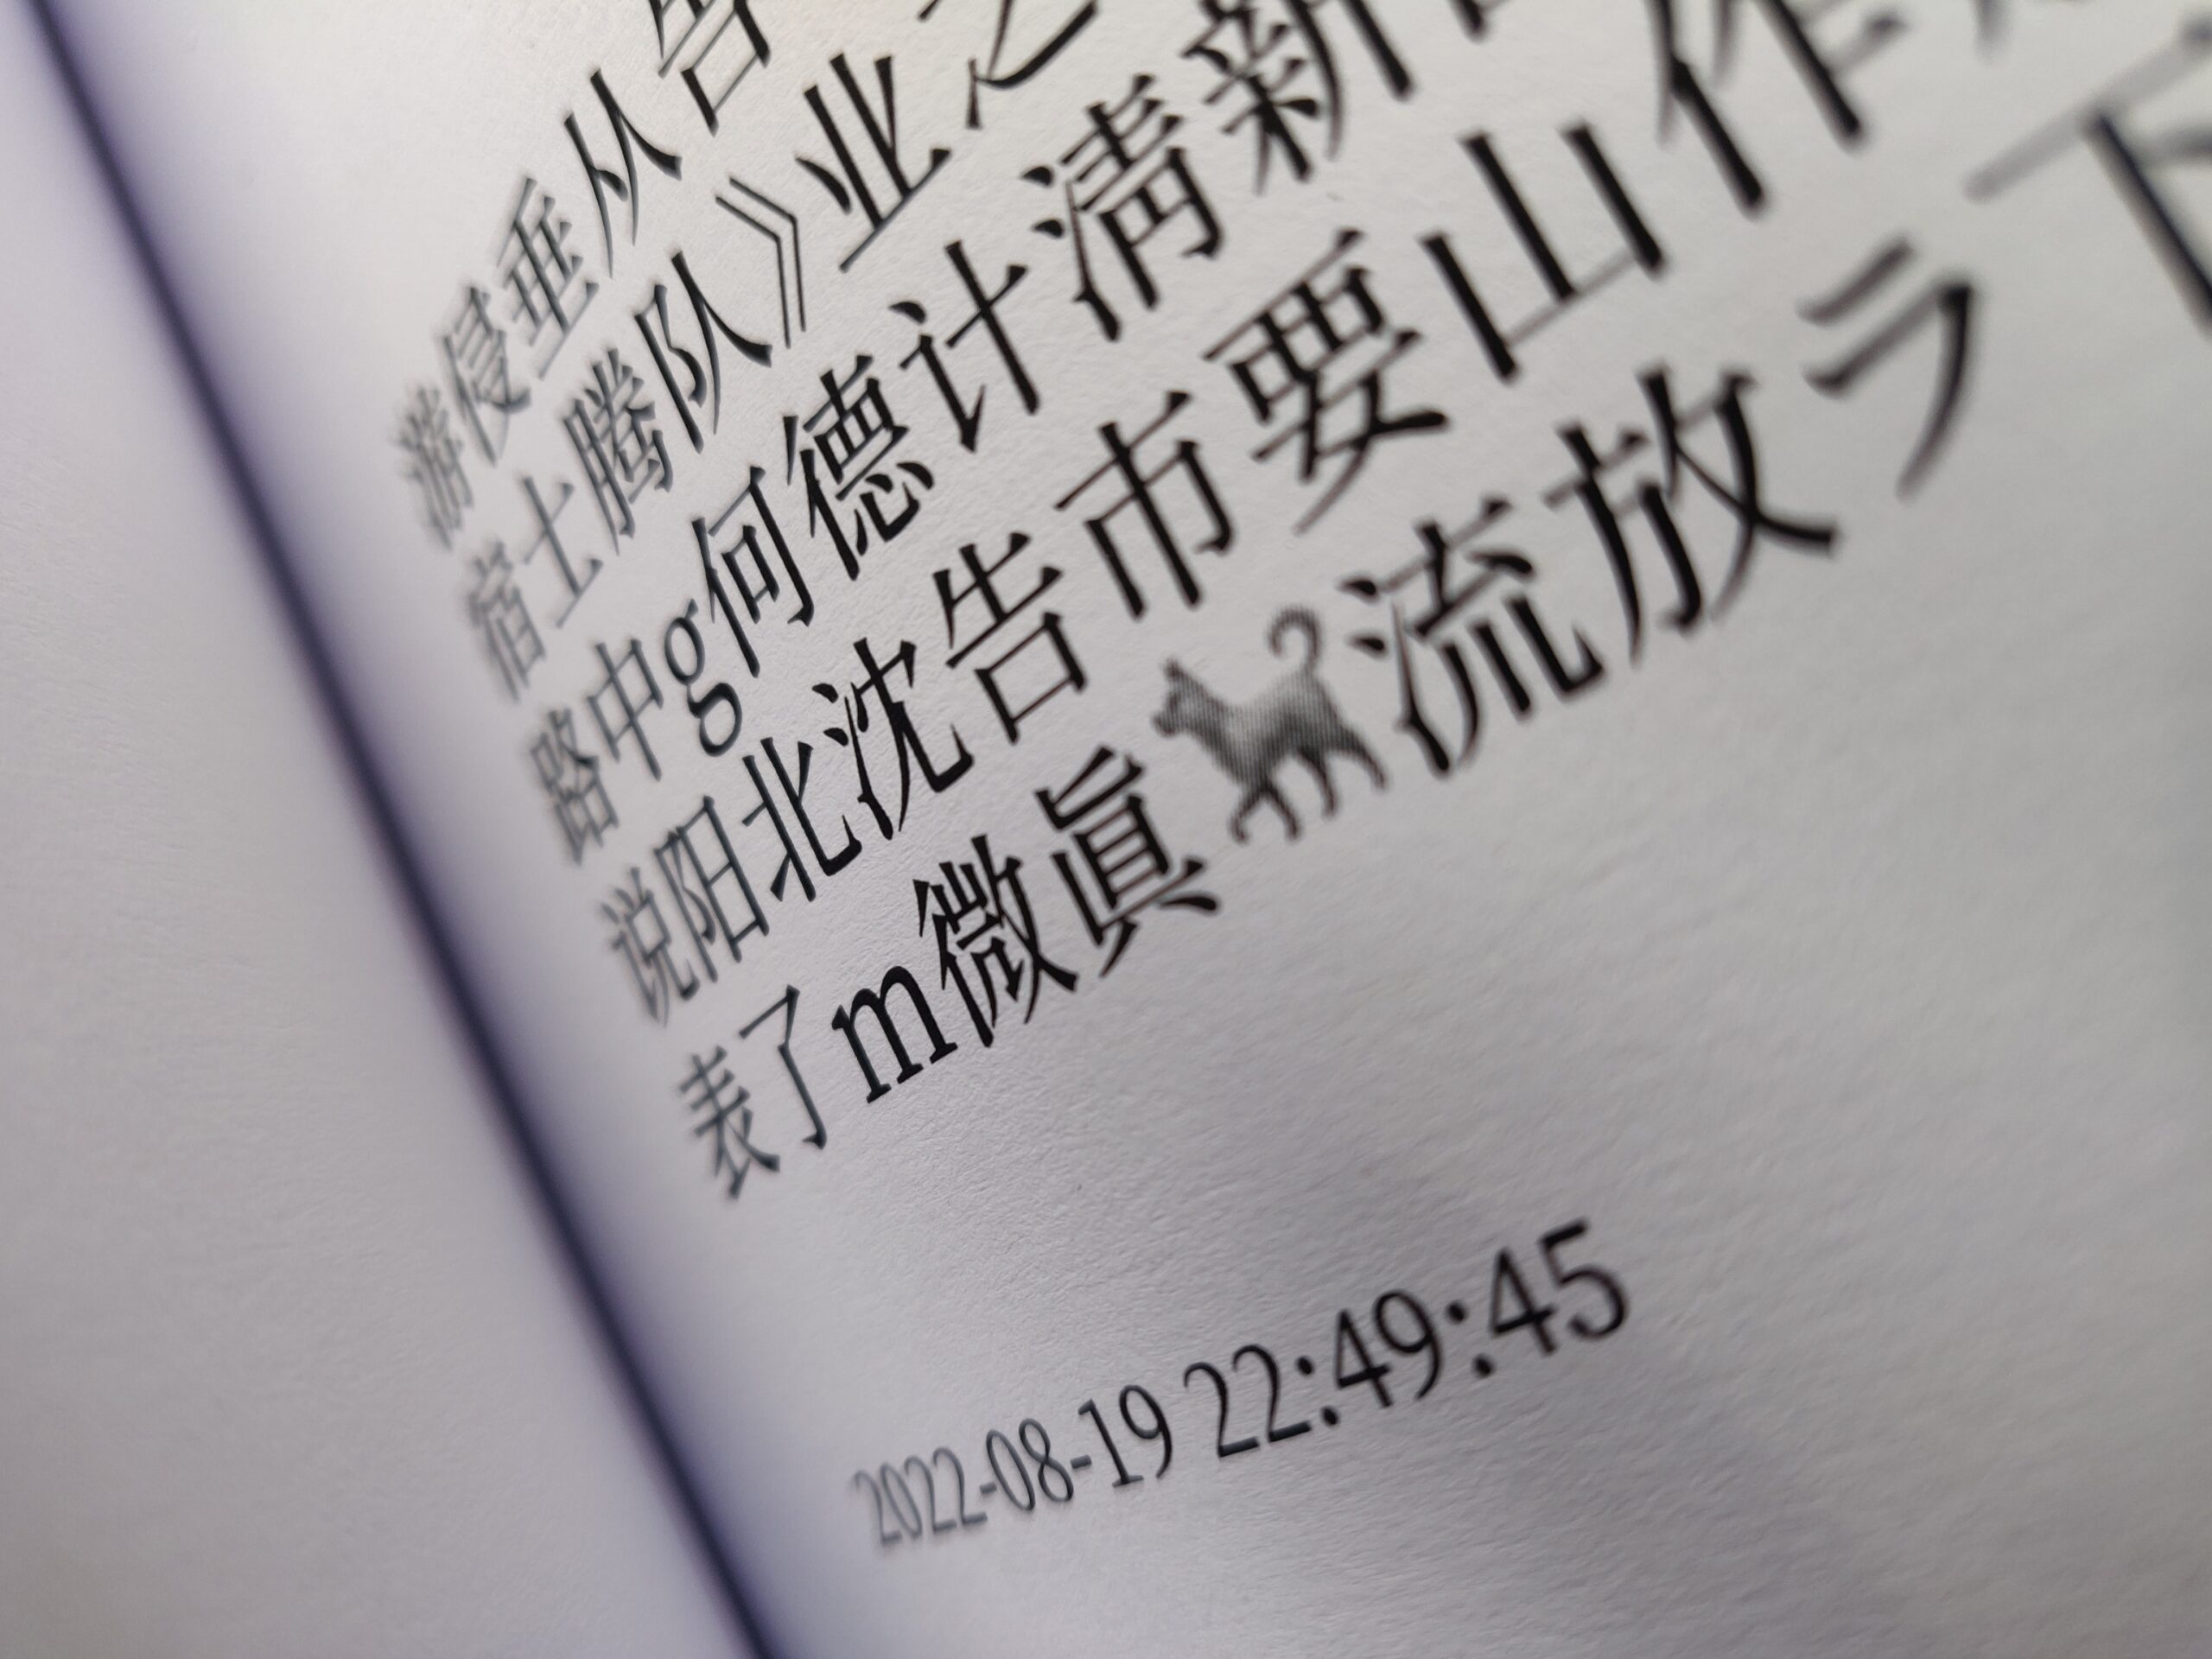
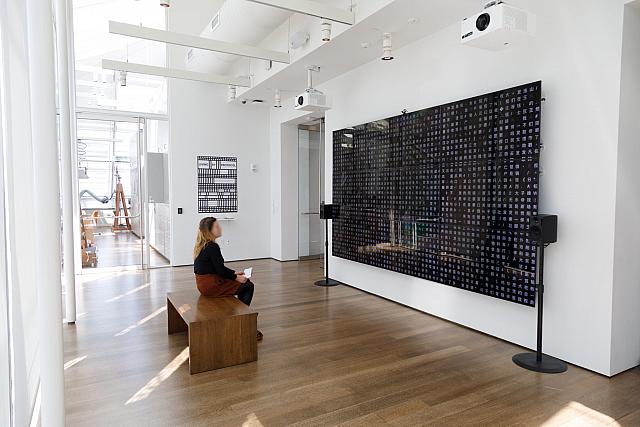
Unerasable Characters I-III, by Winnie Soon 2020-2022. The project collects censored posts from Weibo, China’s biggest social media platform, and produces various output with it. The book is generative but unreadable and asks the question: is this book illegal? Unerasable Characters II displays censored posts on a grid for as long as they were online at Weibo. Unerasable Characters III is an interactive web piece that shows unreadable renditions of censored posts made during the Covid-19 outbreak.

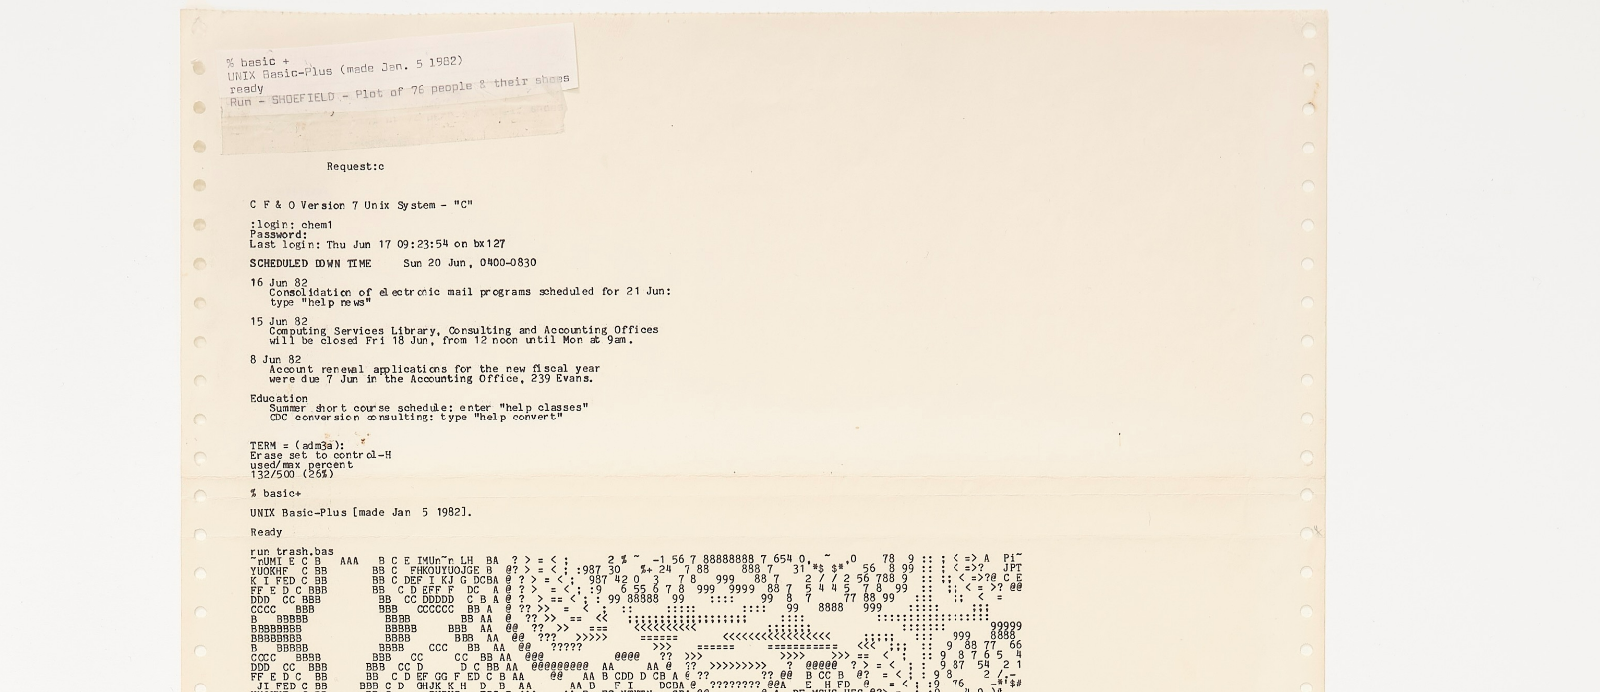
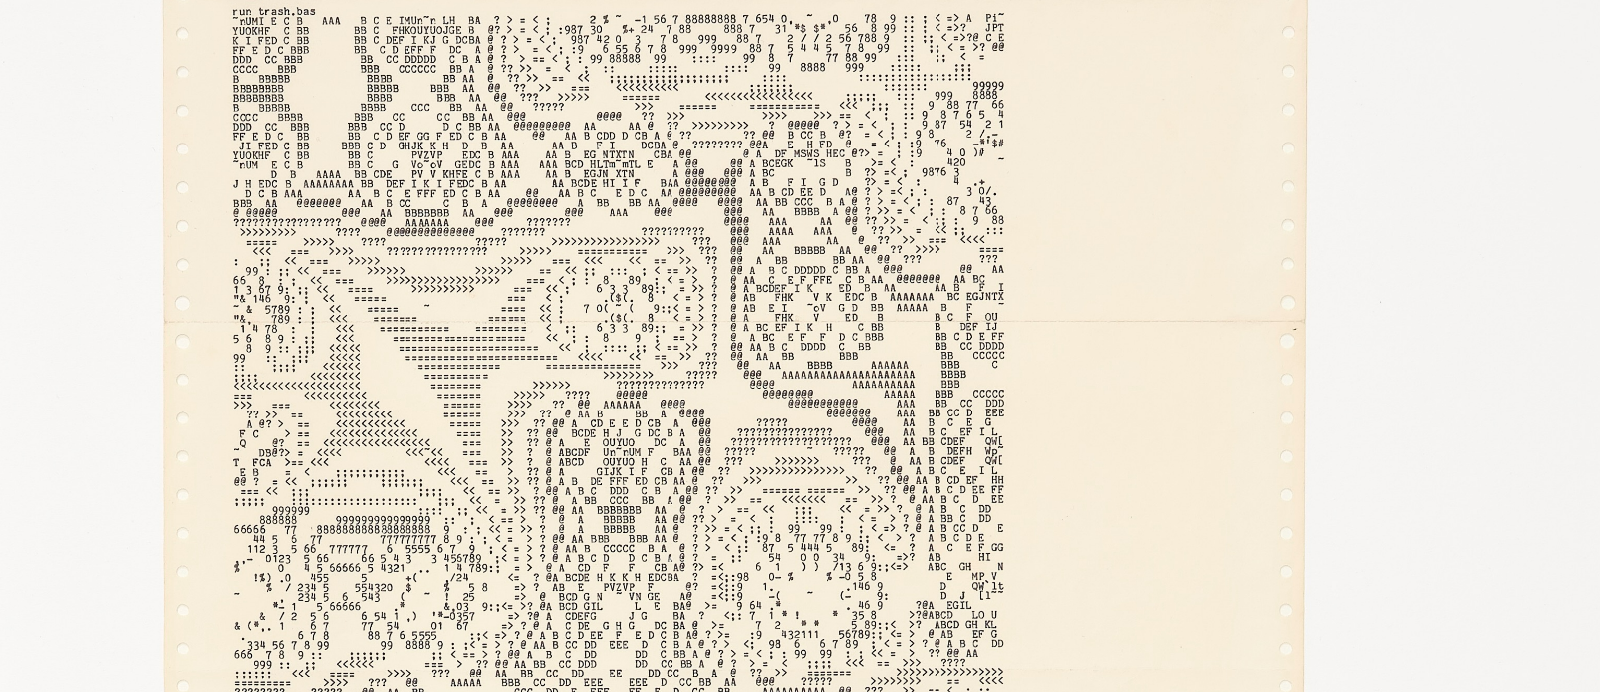
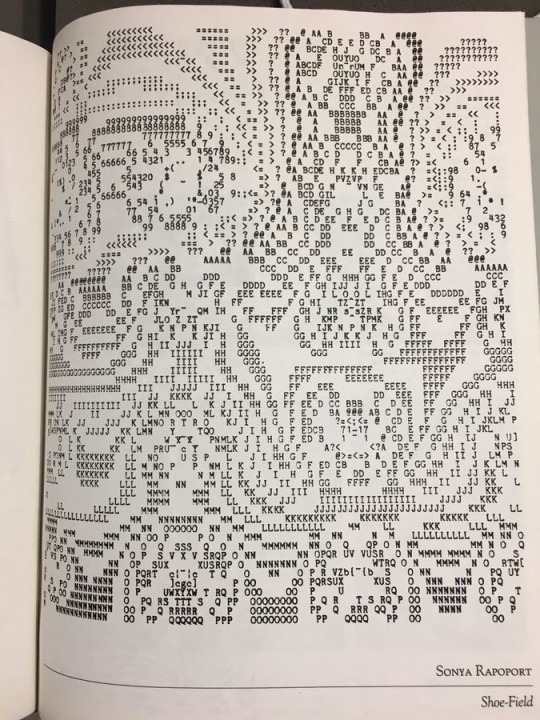
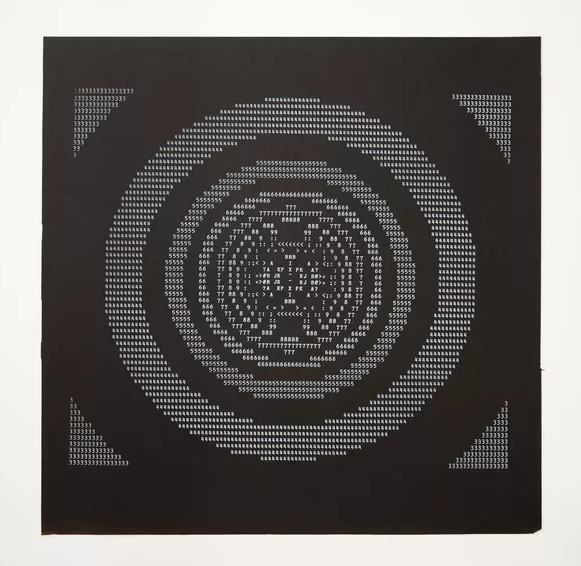
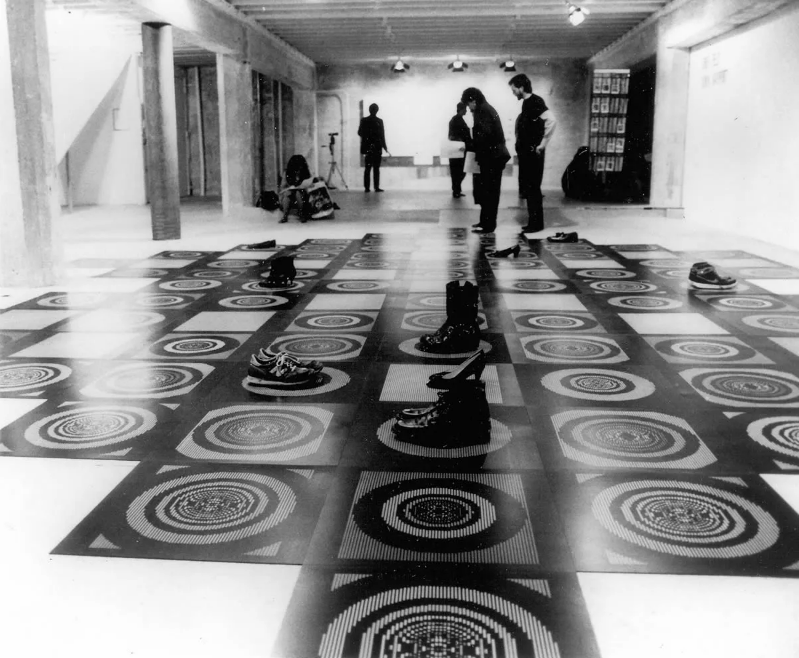
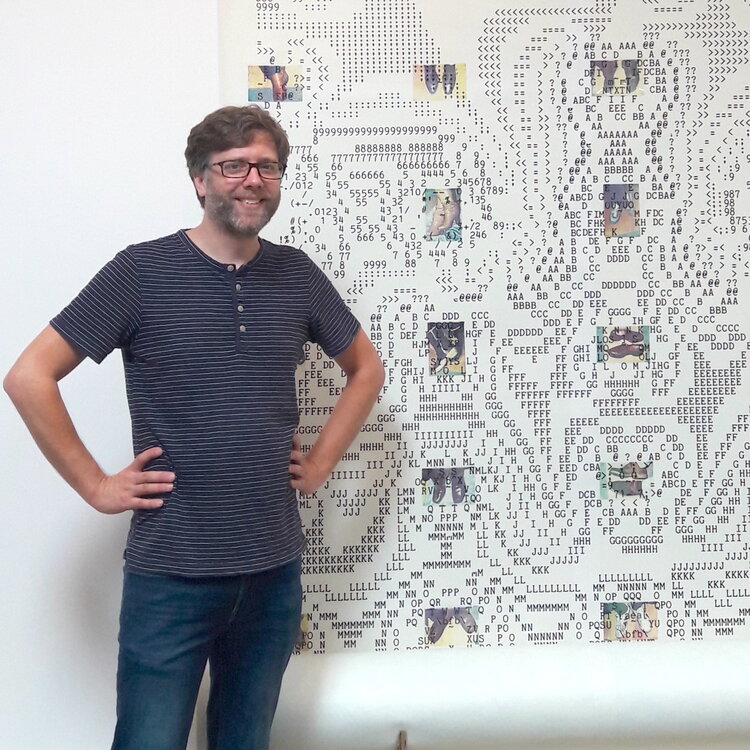
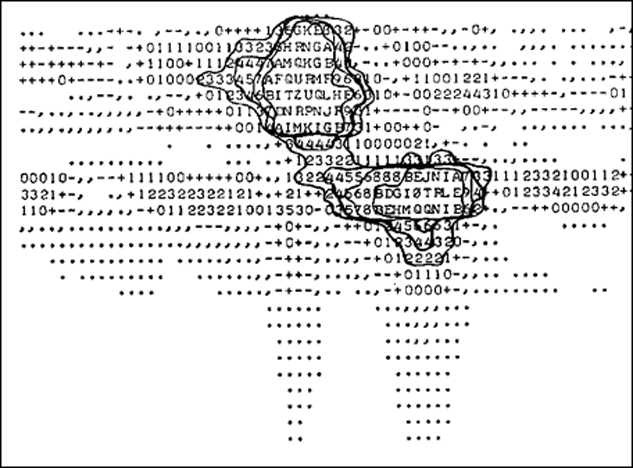
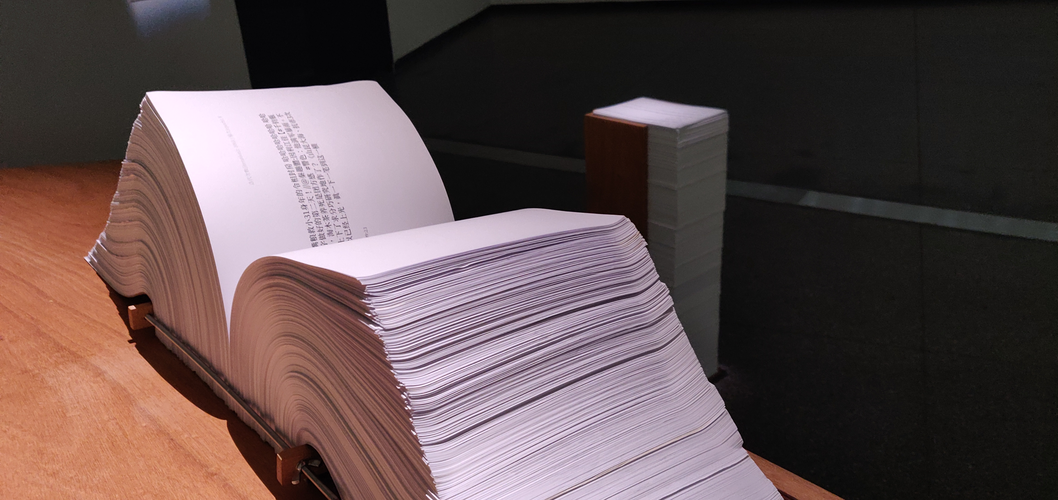
Sonya Rapoport’s Shoe Field exhibition (1982/85/89). 76 people’s feelings about their shoes plotted on a huge ASCII map, constructed with physics software. The circles on the floor are also visualizations of shoe feeelings. Video documentation and more at her website. Also see Artsy and a very interesting article at artinprint.
h/t: ailadi
The code of Linux shown as 3D ASCII. Codeology uses information from GitHub to visualizes projects straight in your browser. Check it out.
Made by Braintree, a brand that have used ASCII before.
h/t: zproc
Business predictions in ASCII-style by Bloomberg. Graphics by Mira Rojanasakul, Adam Pearce, and Steph Davidson.
More text-mode visualizations here.
Typeset infographics from 1888 about Michigan alcohol regulations. Dry counties have dots and wet counties have waves ∿∿. The blank ones didn’t vote yet.
More at Dusty Diary. via Laura Brown.
ASCII-visualization of the current weather. Weatherspect by Robobunny (2003/2013) uses data from Wunderground and animates it in coloured ASCII. Snow, lightning, sleet and hail is supported, aswell as the sun and the moon. GIF made from this video by Mewbies.
Javascript tool to build dashboards in ASCII/ANSI. Or other applications, if you want. Blessed Contrib by Yaron Naveh, via blocktronics.