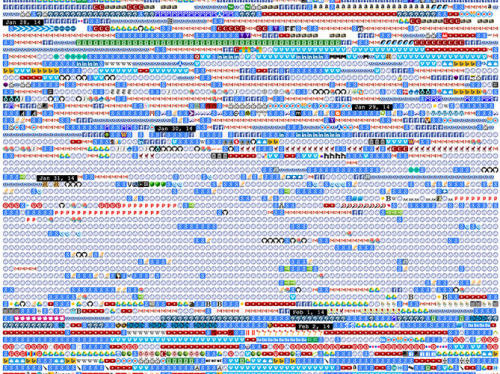
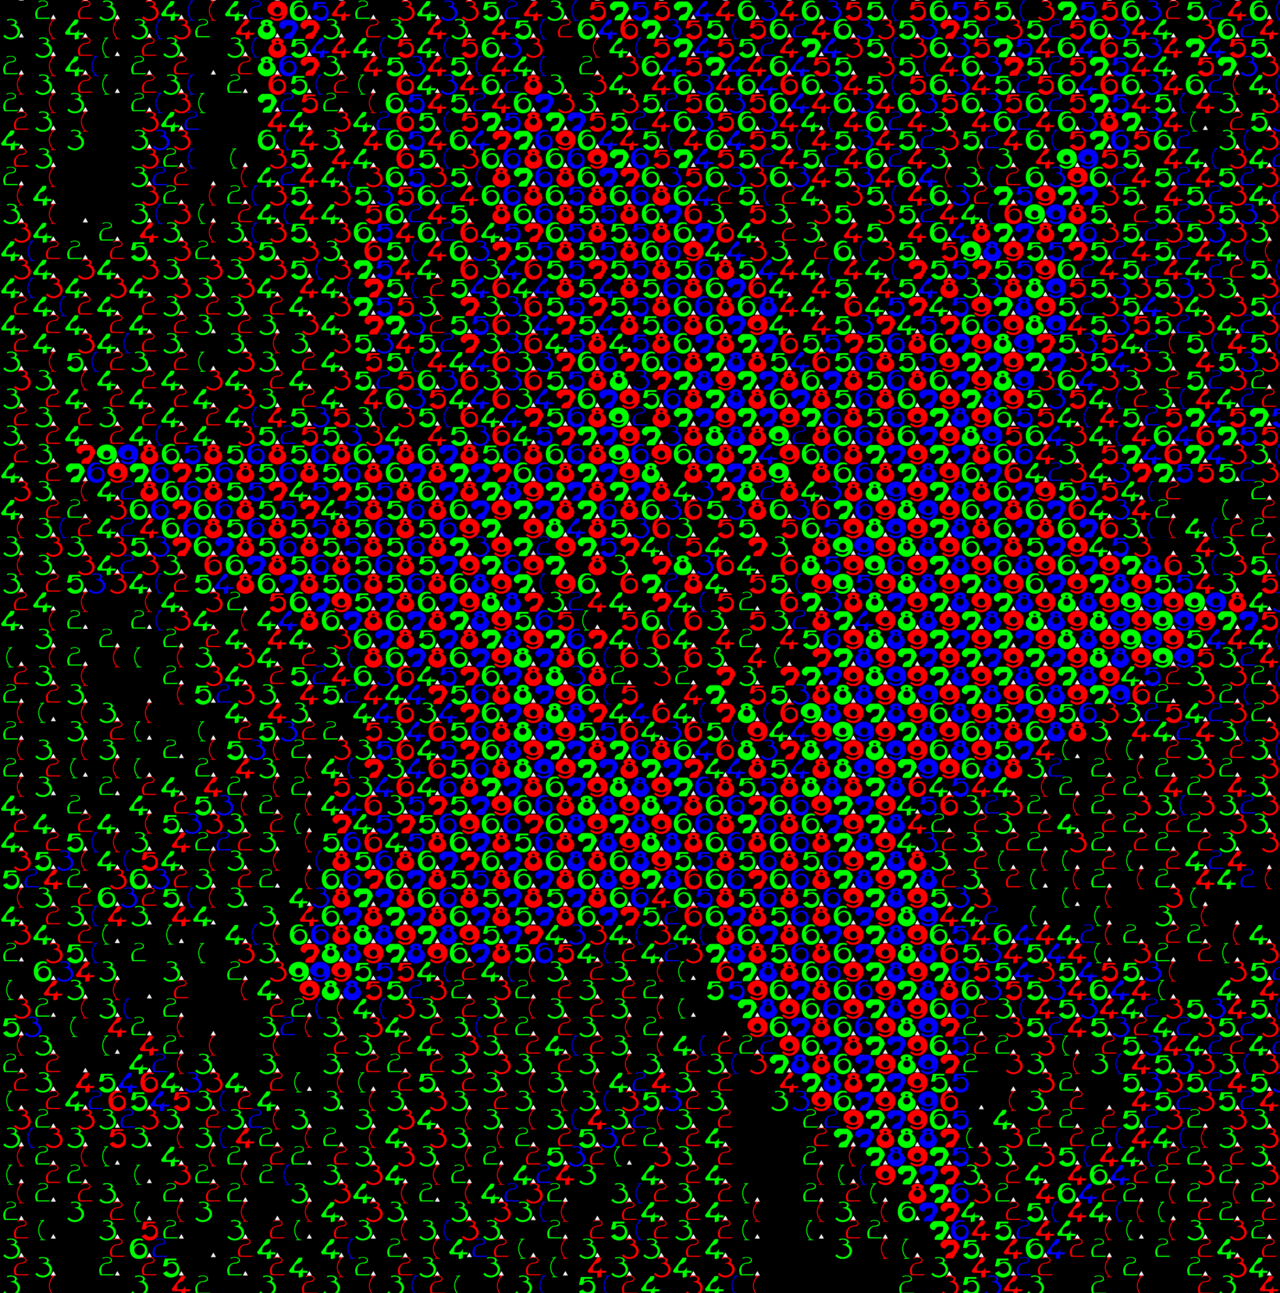
The two first images is from an app that displays time, changing the labyrithic pattern each second (Bifurcan). The second one is a drawing app (Rafinograde).
Made by Devine Lu Linvega.
The two first images is from an app that displays time, changing the labyrithic pattern each second (Bifurcan). The second one is a drawing app (Rafinograde).
Made by Devine Lu Linvega.
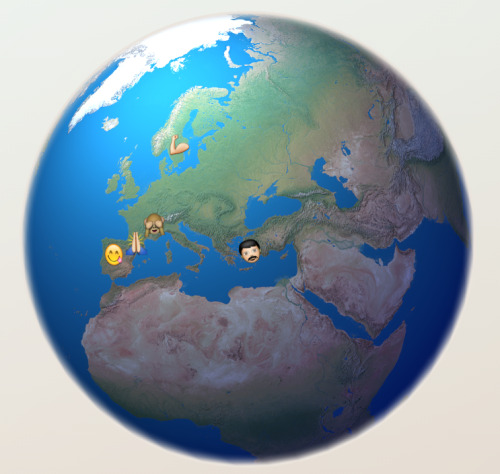
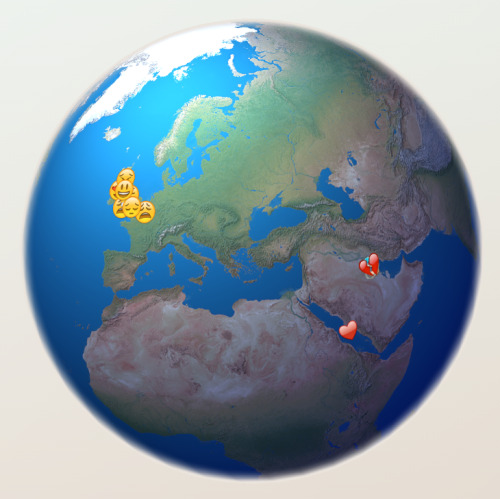
Muscles in Sweden, bla-bla in the UK, monkeys in France, hearts & broken hearts in Saudi Arabia, tongues & clapping in Spain and moustaches in Turkey.
Silicon Feelings – a real-time view of emoji usage around the world
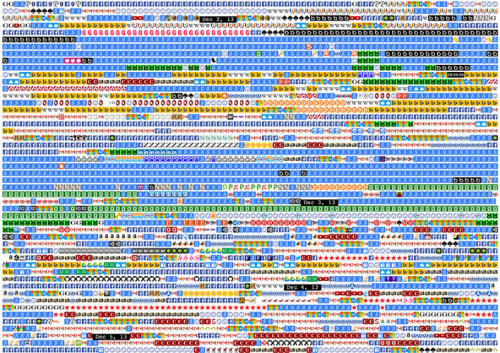
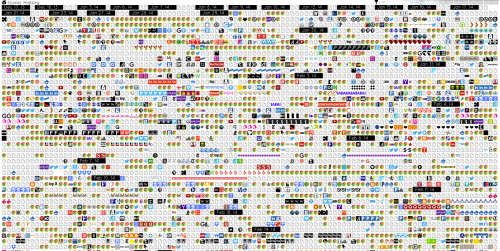
Iconic History, a browser plugin by Shan Huang (2014) to visualize browsing habits with favicons. Images from Fast Company.
2024-update: it still works! links updated
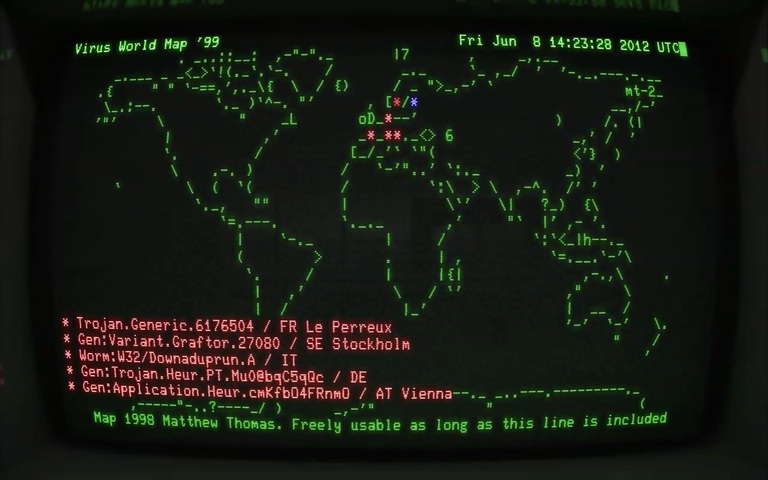
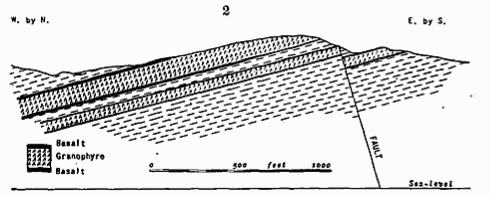
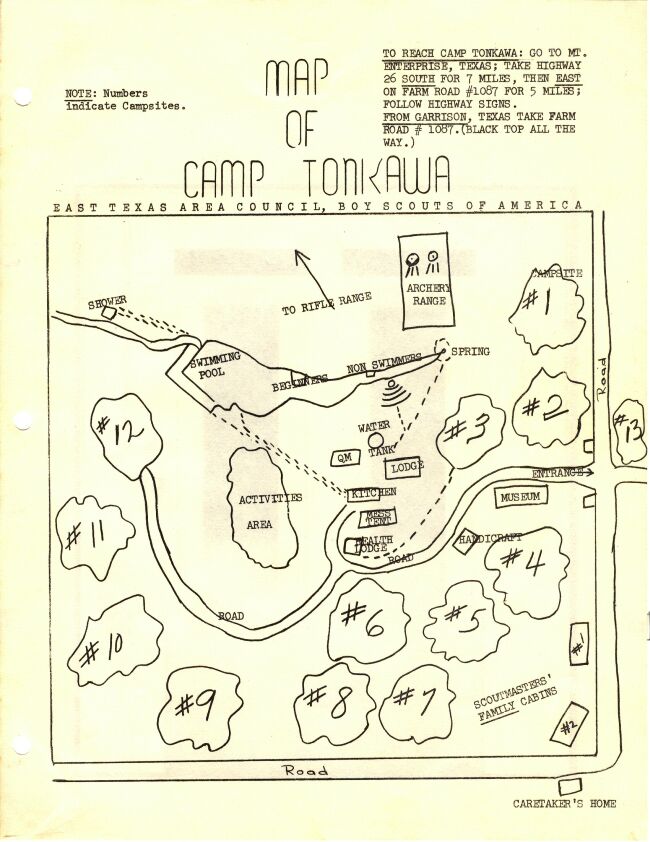
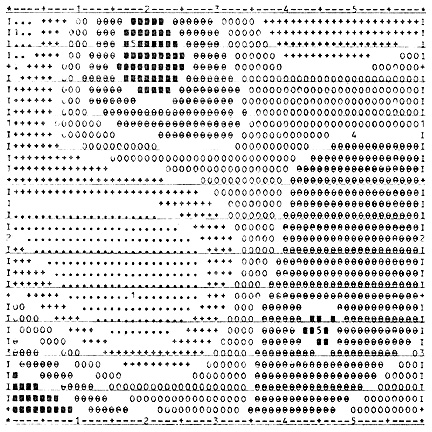
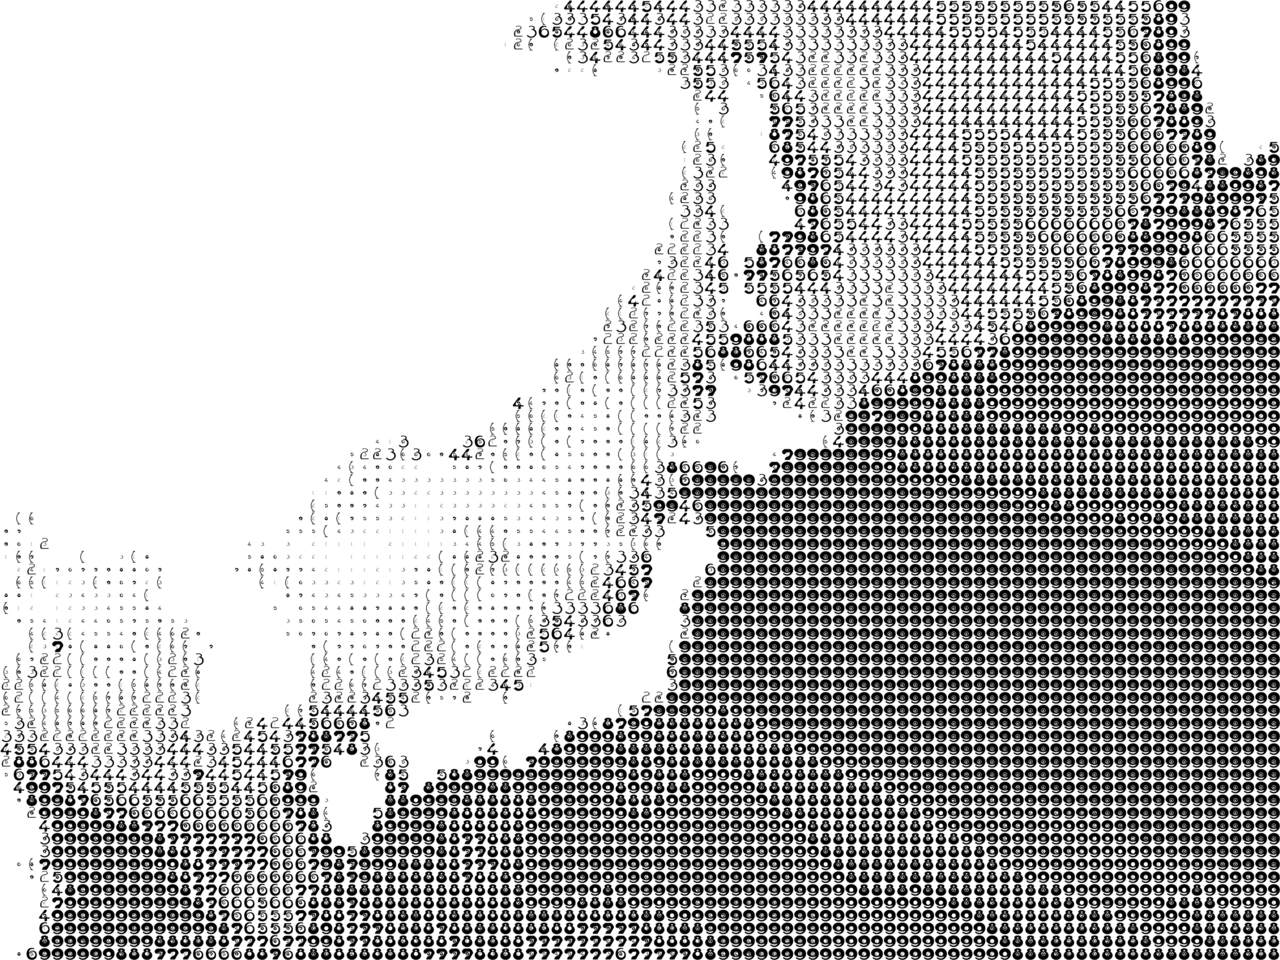
Archeological maps in ASCII from 1975. A good way of visualizing spatial and other information simultaneously, and obviously a forerunner to both text adventure maps and modern cartography, as noted here.
Also check the typewriter maps, fat font for text-mode infovis & the virus map.
Stamen Design mapping energy efficinecy, in text mode style, via.
Making Maps with a Typewriter, via.
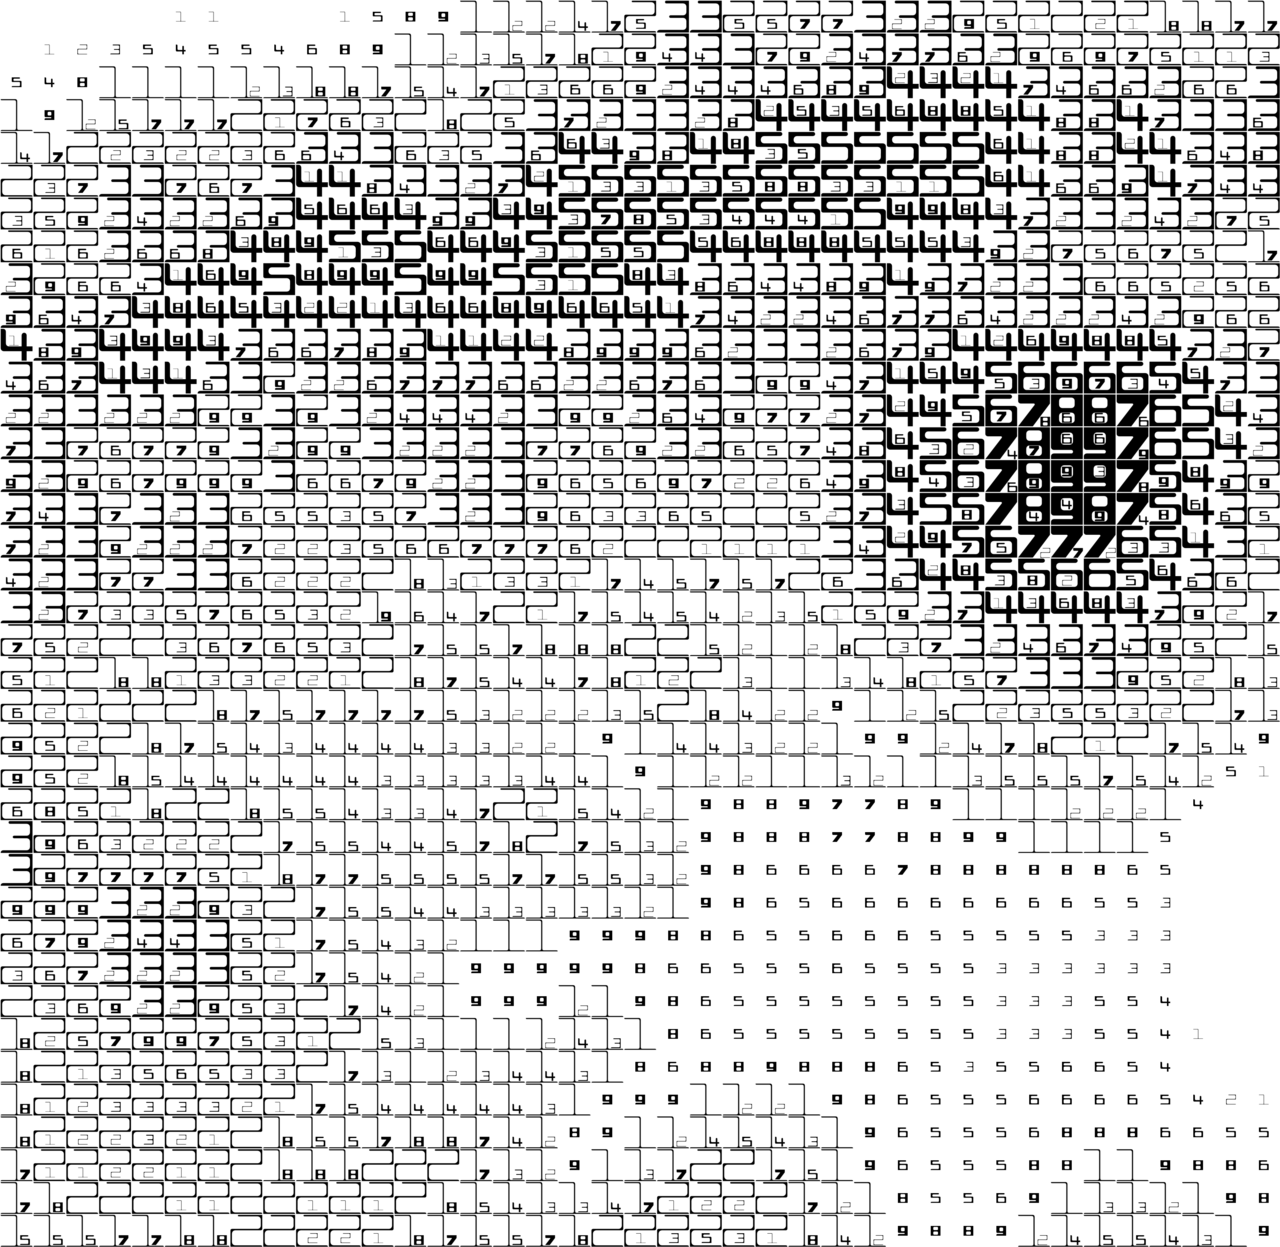
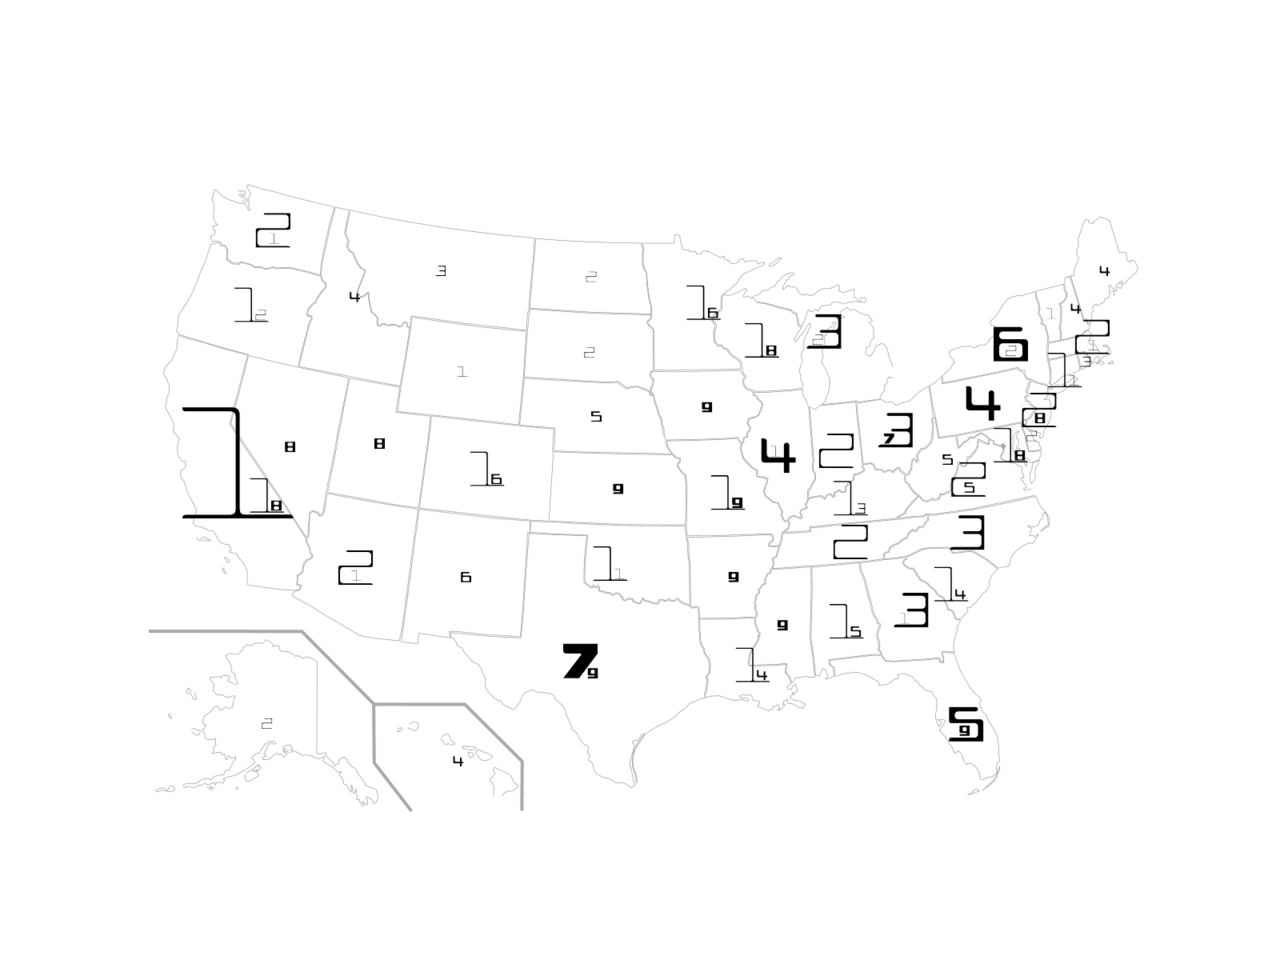
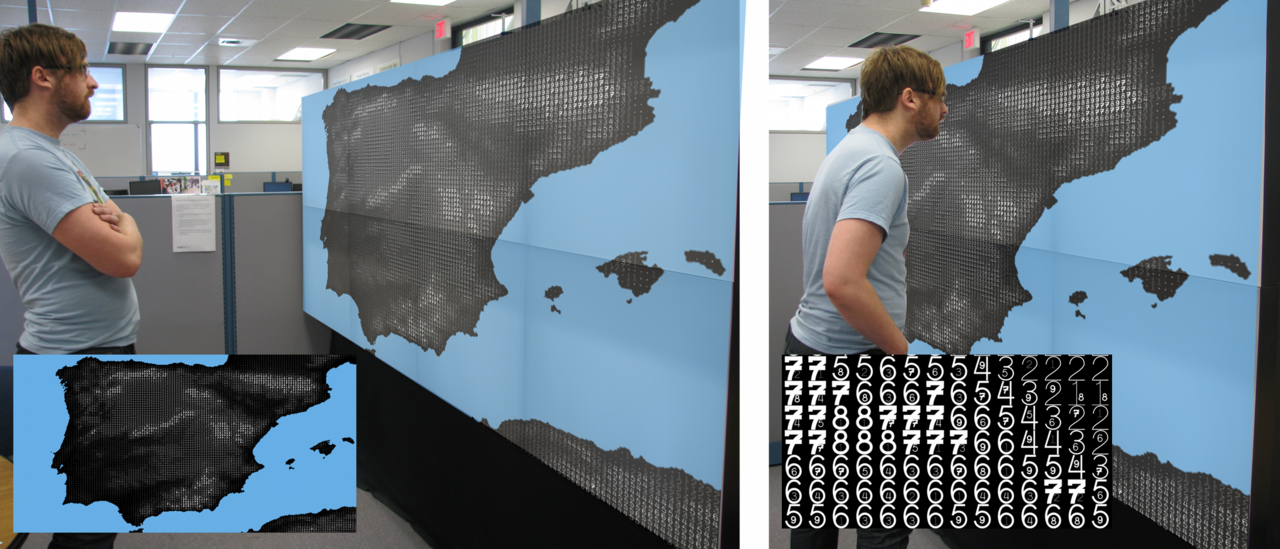
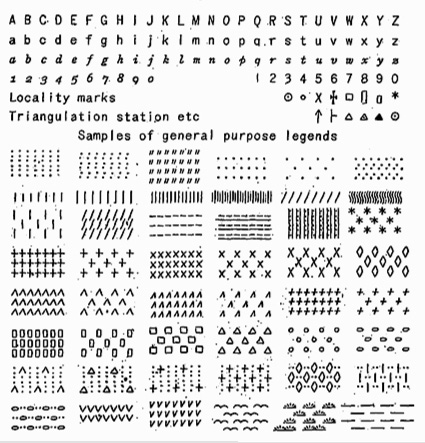
FatFont
Specifically designed for decimal numbers whose boldness corresponds with it’s value, for use in data visualization:
The FatFonts technique is based on a new type of numeric typeface designed for visualization purposes that bridge the gap between numeric and visual representations. FatFonts are based on Arabic numerals but, unlike regular numeric typefaces, the amount of ink (dark pixels) used for each digit is proportional to its quantitative value. This enables accurate reading of the numerical data while preserving an overall visual context.
Fatfonts are designed so that the amount of dark pixels in a numeral character is proportional to the number it represents … This proportionality of ink is the main property of FatFonts. It allows us to create images of data where you can read the numbers, and represent tables that can be read as images.
You can find out more about the project here